

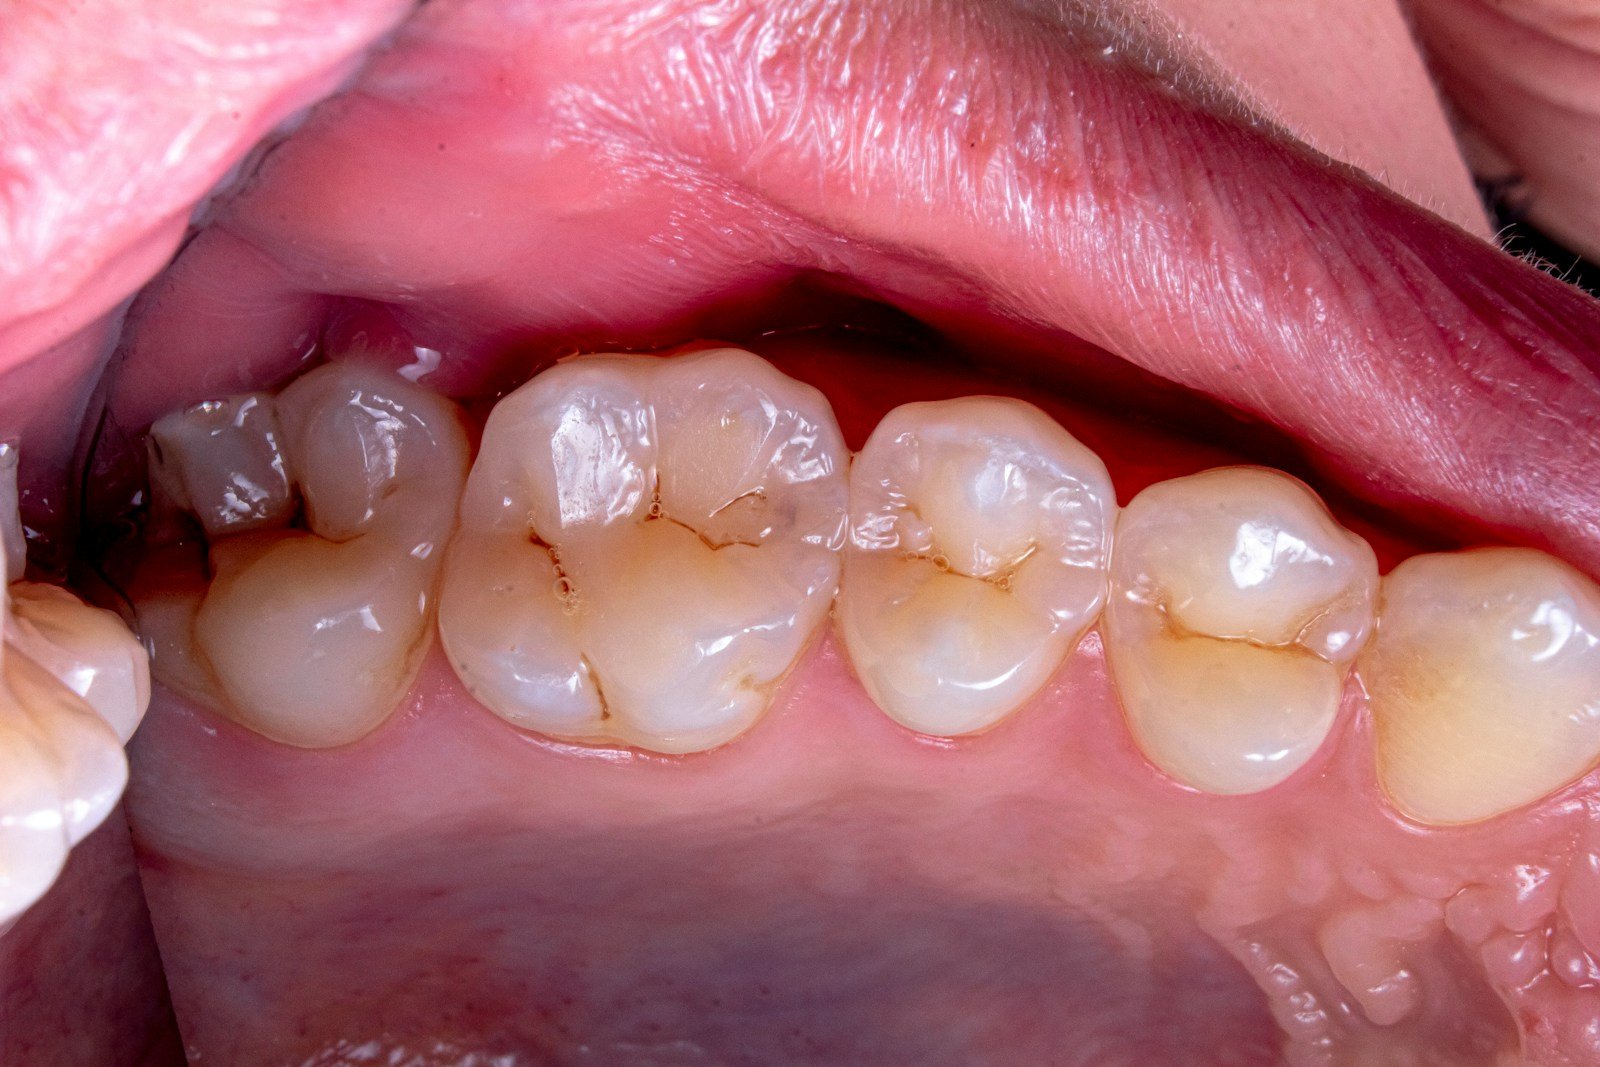
Snap a photo of your lower teeth, upload it, and get back a number that says exactly how crooked they are — no goopy impression tray, no scanner wand poking the back of your mouth. That is the quietly radical promise behind AI teeth crowding measurement, and a new German study just put it to a strict test.
The 30-Second Version
- Researchers at the University of Münster trained a neural network to measure lower-front-teeth crowding — Little’s Irregularity Index — straight from a routine intraoral photo.
- Per tooth it was tight: average error of just 0.42 mm, with 90% of landmarks placed within 1 mm.
- But the whole-arch index overshot — it read crowding about 1 mm too high on average, and its error band (−1.36 to +3.50 mm) blew past the ±2 mm the team set as clinically acceptable.
- The authors’ own verdict: a complementary tool, not a replacement for the mold — and it was one center, one annotator, lower front teeth only.
It sounds like the end of the impression tray. But the researchers — Kanemeier, Ergün, Stamm, Middelberg and Schmid, writing in BMC Oral Health (2026) — did something most feasibility papers skip: they decided in advance how accurate the tool would have to be to count as “as good as a human,” then tested whether it cleared that bar. The guiding question was not “can a photo estimate crowding?” but “can it do so tightly enough to trust?”
The study, in one glance
The team used an HRNet convolutional neural network to find the contact points of the six lower front teeth on standard occlusal intraoral photographs, then summed the gaps between them to compute Little’s Irregularity Index. They trained on 225 images from 80 patients, and — crucially — reported all their headline numbers on a separate, statistically powered test set of 60 photos from 60 patients who never appeared in training.
What AI teeth crowding measurement already does well
On the pure task of finding landmarks, the model was genuinely good. Its mean radial error was 0.55 mm, and 90% of contact points were placed within a millimetre of where a human put them. The front teeth were easiest of all — central incisors landed with just 0.30–0.33 mm of error. At the level of a single tooth’s displacement, the network’s average miss was 0.42 mm, and its per-tooth agreement band (−0.74 to +1.17 mm) sat entirely inside the clinically acceptable zone. For something extracted from an ordinary photo, taken without impressions or a scanner, that is real progress — and it hints at exactly the use cases the authors care about: remote check-ins, more comfortable records for patients with a strong gag reflex, and early warning when a bonded retainer quietly fails.
So why can’t it replace the mold yet?
Because Little’s Irregularity Index is a sum. It adds up five separate gaps between the front teeth, so five small landmark errors don’t cancel — they stack. On the full index, the model’s average error grew to 1.37 mm, and it showed a statistically significant tendency to overestimate crowding by 1.07 mm (95% CI 0.75–1.39). Its 95% limits of agreement ran from −1.36 mm all the way to +3.50 mm. The team had set ±2 mm as the line for clinical equivalence in advance; the confidence intervals around those limits reached as high as 4.05 mm, so the pre-registered test failed and the tool could not be called equivalent to manual measurement.
⚠ Small errors, big sum
A fifth of a millimetre at each contact point is nothing on its own. Add five of them together, then convert everything to real millimetres using a population-average molar width, and the running total can drift by more than a whole tooth’s width.
It’s like adding up five slightly-off tape-measure readings: each one is close, but the running total wanders.
The harder landmarks made it worse. Canines and first molars were the toughest to locate (0.54–0.99 mm error), and because the molars are what the system uses to set the photo’s scale, an error there propagates into every measurement on that image. The scaling itself leans on an average molar width from a meta-analysis rather than the patient’s own anatomy — a reasonable shortcut, but one that can’t account for individual variation or the perspective distortion of a handheld photo.
Who checks the number?
Here’s a subtlety worth sitting with: the study measured agreement against a human’s manual annotations of the same photographs — not against physical casts or 3D digital scans. So what it really shows is that the AI roughly matches a person reading the same picture, not that either matches the true geometry of the mouth. Add the single-center design, a single annotator drawing all the reference points, and a retrospective dataset, and you have a careful proof of concept rather than a validated clinical instrument. The authors are refreshingly plain about this, and they lay out the next step: prove equivalence, then validate the whole workflow against casts or 3D models across multiple centers.
Who does remote crowding-monitoring actually help?
The upside is real for anyone who lives far from an orthodontist, or who needs their teeth watched between long appointment gaps — the paper singles out catching fixed-retainer failure early, before it turns into the painful “wire syndrome.” But equitable reach cuts both ways. A single population-average molar width baked into the scaling assumes a “typical” arch, and a model trained at one German university clinic on one population may not travel to mouths that look different. The team also notes that extreme, severely crowded cases were underrepresented — and those are often the patients who most need an accurate number.
What this means for you
If you’re a patient
Don’t treat a phone-app “crowding score” as a diagnosis — this technology isn’t there yet. Where it could genuinely help sooner is flagging change over time: a shift since your last visit that’s worth getting checked, especially if you wear a bonded retainer.
If you’re a clinician
Promising for triage and remote check-ins, and a plausible early-warning system for retainer surveillance. But keep casts or scans for treatment decisions, and remember the systematic overestimation: this model tends to make crowding look slightly worse than it is.
The bottom line
A photo can already tell you, tooth by tooth, that something is shifting. What it can’t yet do is tell you reliably by how much — because the crowding index is a sum, and sums magnify small mistakes. Treat this as an assistant that raises its hand, not an oracle that hands you a verdict.
Frequently asked questions
What is Little’s Irregularity Index?
It’s a single score of how misaligned the six lower front teeth are, introduced by Robert Little in 1975. It sums the displacements between the contact points of those teeth, and is traditionally measured with a caliper on a dental cast.
How accurate was the AI teeth crowding measurement?
Per tooth it averaged 0.42 mm of error, with 90% of landmarks within 1 mm. For the whole index, average error was 1.37 mm and the agreement band ran from −1.36 to +3.50 mm — overshooting the ±2 mm the researchers set as the acceptable limit.
Can I measure my own crowding from a phone photo?
Not reliably yet. This is a research proof of concept built on standardized occlusal photos from one clinic; the authors call it a complementary tool, not a replacement for a proper cast or scan.
Why does the whole index err more than each tooth?
Because it’s additive. The index sums five separate gaps, so several tiny landmark errors stack instead of canceling — and errors in the molars, which set the photo’s scale, spread to every measurement on the image.
Could this ever replace impressions or scans?
Possibly, but not before it proves equivalence to manual measurement and is validated against physical casts or 3D models across multiple centers and populations. For now it’s a foundation, not a finished tool.
Source & author credit
This article interprets, and does not reproduce, the following peer-reviewed study. All figures are the authors’ original findings.
Kanemeier M, Ergün T, Stamm T, Middelberg C, Schmid JQ. Automated measurement of Little’s Irregularity Index on intraoral photographs using a convolutional neural network. BMC Oral Health. 2026;26(1):1748. DOI: 10.1186/s12903-026-09870-7
ORCID — Moritz Kanemeier: 0000-0002-4223-0010
Published open access under a Creative Commons Attribution 4.0 (CC BY 4.0) license. Decadentry is an independent educational publication and is not affiliated with the study’s authors. Related reading: Black Triangles After Clear Aligners: Can AI Predict Them?
Leave a Reply