

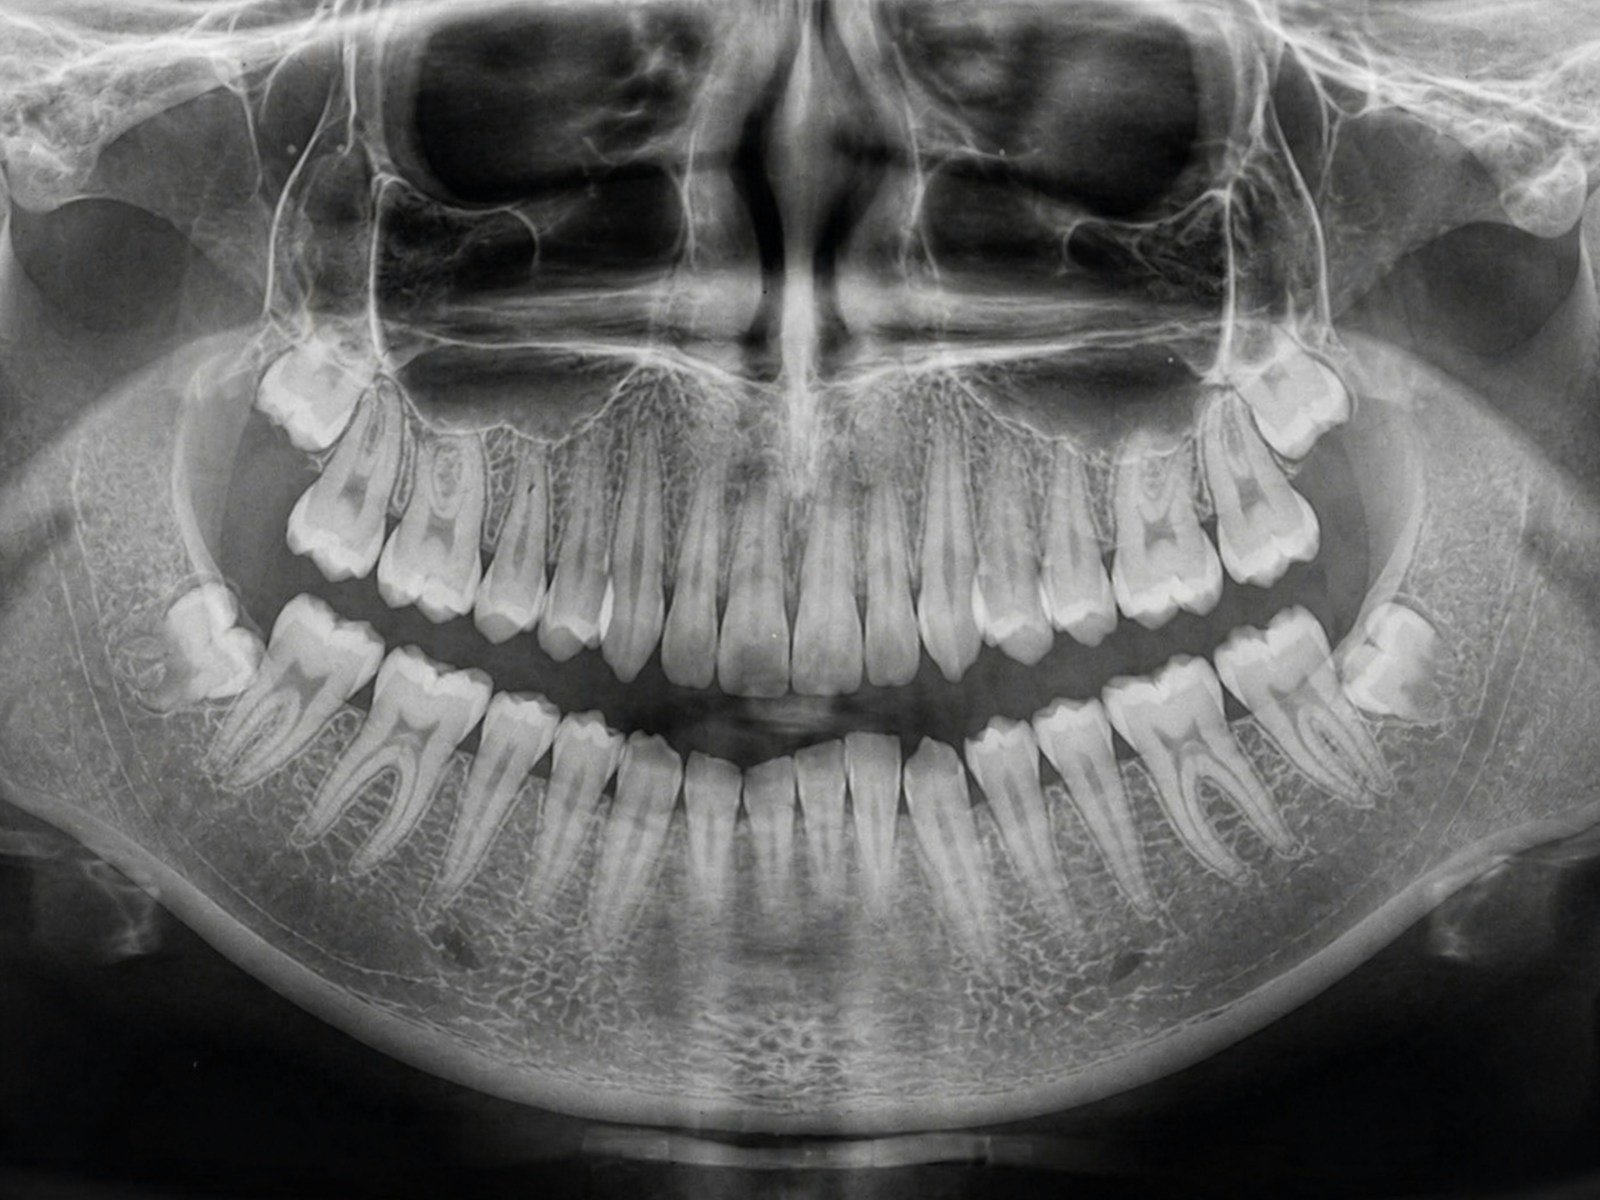
A single dental panoramic X-ray is really a stack of small verdicts: which teeth wear crowns, which carry a root filling, where an implant sits in the bone, and whether a faint shadow at a root tip is a cyst or nothing at all. A dentist reads them one at a time, then types each into a chart. A new system claims to do the whole sweep — chart and written report included — in about the time it takes to rinse and spit. This is AI dental charting: one model that reads the entire film and fills in the paperwork.
The 30-Second Version
- A Belgian-led team built Panognostics-Plus, an AI that reads a full panoramic X-ray and returns a dental chart plus a structured report in about 15 seconds.
- On its best categories it was near-flawless — dental implants at an F1-score of 0.98 — and it traced teeth and treatments with 0.96–0.97 overlap against expert outlines.
- It was not equally good everywhere: its improvements on gum-supporting bone level and on fillings did not reach statistical significance.
- The honest caveat: this is a single-dataset “technical validation,” with no outside clinic and no real-world reader test yet.
It sounds like the quiet end of hand-charting. But the claim comes from a development-and-technical-validation study — useful to read carefully, not to take at face value. In the Journal of Imaging Informatics in Medicine, Soroush Baseri Saadi, Reinhilde Jacobs and colleagues (KU Leuven and Karolinska Institutet) describe Panognostics-Plus, a cloud-based framework that uses a family of YOLO object-detection models to find anatomy, existing dental work and root-tip disease on one radiograph, then assembles a chart and a written report. The question worth asking is not “is it fast?” — it clearly is — but “is it evenly good, and tested on anyone else?”
The study, in one glance
The researchers trained and tested the system on a retrospective set of 1,595 panoramic radiographs, with separate modules for dental anatomy, dental treatments and periapical (root-tip) diagnostics. They benchmarked four generations of the detector — YOLOv8m, YOLOv9m, YOLO11m and the newest YOLO26m — and YOLO26m came out on top. The whole pipeline produced a segmentation overlay, a dental chart and a structured radiological report in 15 ± 1.4 seconds per image.
What AI dental charting actually gets right
The impressive part is breadth at speed. Rather than one narrow detector hunting a single lesion, Panognostics-Plus reads the whole mouth in one pass and hands back a finished-looking chart and report. And on the structural findings it was genuinely strong. Dental implants — the most radiopaque, distinctive thing on a panoramic — were detected with a precision of 0.99, a sensitivity of 0.98 and an F1-score of 0.98. When it outlined where things were rather than just flagging them, it overlapped expert tracings closely, with Dice coefficients of 0.97 for dental anatomy and 0.96 for dental treatments. Even root-tip disease, which humans often argue over, landed well: radicular cysts at an F1 of 0.94 and periapical granulomas at 0.91. A dentist who spends real minutes clicking each tooth into a charting system can see the appeal of a 15-second first draft.
Does it read every finding equally well?
No — and this is where the fine print matters. The headline numbers are averages across very different tasks, and the study is admirably explicit that some of them held up statistically and some did not. Of ten detection tasks, eight showed significant improvements for the newest model; two did not. The reading of the periodontal bone level — the height of bone that signals gum disease — looked like one of the biggest jumps on paper (+14.3%), yet the difference between models was not statistically significant (p=0.193). Detecting dental fillings came up short of significance too (p=0.073). In other words, a big-looking percentage is not the same as a reliable one.
⚠ A gain you can see is not always a gain you can trust
The single most clinically loaded number here — how well the model reads gum-supporting bone — carried one of the largest apparent improvements and one of the weakest statistical cases for it. On a tool meant to flag gum disease, that is exactly the box you would want certainty in.
A dental chart is only as good as its worst square. One wrong tooth number quietly poisons everything built on top of it.
There is a deeper limit, too. Every one of these numbers comes from a single retrospective dataset of 1,595 images. The model was never shown radiographs from a second clinic, a different X-ray machine or another population. The authors call this a “technical validation” for good reason: it proves the pipeline works on the data it was built with, not that it travels.
Who signs the chart the machine wrote?
A structured report that looks finished invites a dangerous shortcut: trusting it because it reads like a human wrote it. But the chart is a draft, and a draft that is 98% right on implants and shakier on the dark shadow of an infected root tip still needs a clinician to read the film themselves and own the result. The legal and ethical signature on a dental record belongs to a person, not a pipeline — and a chart that auto-populates is only a time-saver if the time saved is not spent later untangling a confident mistake.
Will every clinic get the same read?
This is the quiet equity question behind every single-center study. Panoramic machines differ in dose, geometry and image quality; patient populations differ in anatomy, dental work and disease patterns. A model tuned on one archive can read beautifully there and stumble on the slightly different images down the road — which is why this work sits squarely in the wider, still-unfinished project of getting AI to reliably read dental diagnostics and imaging across real, messy clinics. Until Panognostics-Plus is tested on outside data, “it works” means “it worked here.”
What this means for you
If you’re a patient
If your dentist uses a tool like this, think of it as a fast first pass that still gets checked by a human. It may speed up your visit and catch an obvious crown or implant, but it is not reading your gum health or your fillings with proven certainty — your dentist’s own look at the X-ray still decides.
If you’re a clinician
Treat an auto-generated chart as a draft to verify, not a record to sign. The strongest performance is on structural findings; the softest is on periodontal bone level and fillings, the places where an unchecked auto-entry could quietly mislead. Ask any vendor the one question this study answers honestly for itself: where is the external validation?
The bottom line
Panognostics-Plus is a striking demonstration that an AI can sweep a whole panoramic X-ray and hand back a chart and report in seconds. But a fast draft on one clinic’s data is a starting point, not a verdict. The value of charting was never the typing — it was the judgment behind each entry, and that still belongs to the dentist. This is an assistant that fills in the form, not an oracle that reads the patient.
Frequently asked questions
Can an AI really chart a whole dental X-ray by itself?
In this study it produced a full dental chart and a structured report in about 15 seconds, and it was near-perfect on some findings (dental implants at an F1-score of 0.98). But it was a technical validation on one dataset, so it is best understood as drafting the chart for a dentist to check — not signing it off alone.
How accurate is it, really?
It depends on the finding. It was strong on dental implants (precision 0.99, sensitivity 0.98) and on outlining teeth and treatments (Dice 0.96–0.97), and good on root-tip cysts and granulomas (F1 0.94 and 0.91). It was weaker and statistically uncertain on gum-supporting bone level and on fillings, where the model’s gains did not reach significance.
Does this replace the dentist or radiologist reading the X-ray?
No. The authors frame it as a way to improve efficiency, and there was no external validation and no real-world reader study. The final reading of the radiograph and responsibility for the chart stay with the clinician.
What is the biggest limitation?
It was built and tested on a single retrospective set of 1,595 panoramic radiographs, with no second clinic, no different X-ray machine and no other population. So we know it works on its own data — we do not yet know how it performs elsewhere.
Source & author credit
This article interprets, and does not reproduce, the following peer-reviewed study. All figures are the authors’ original findings.
Baseri Saadi S, Gracea RS, Ver Berne J, Claes P, Jacobs R. Panognostics-Plus: An Integrated Multi-Task AI Framework for Automated Panoramic Radiograph Interpretation with Dental Charting and Structured Reporting—Development and Technical Validation Study. Journal of Imaging Informatics in Medicine. 2026; advance online publication. DOI: 10.1007/s10278-026-02479-w
ORCID — Soroush Baseri Saadi 0000-0002-2092-6076; Rellyca Sola Gracea 0000-0002-3940-0891; Jonas Ver Berne 0000-0002-8879-6052; Peter Claes 0000-0001-9489-9819; Reinhilde Jacobs 0000-0002-3461-0363
Published under a Creative Commons Attribution 4.0 International (CC BY 4.0) license. Interpreted and fact-checked against the primary source under Decadentry’s editorial standards. Decadentry is an independent educational publication and is not affiliated with the study’s authors.
Leave a Reply